 Raman Sample Analyzer
Scan planning tool for Raman microscopy
You're setting up a Raman microscopy session. Your sample is an irregular tissue slice, a mineral fragment, or a polymer film, not a perfect rectangle. You need to cover every relevant area, but you can't afford to waste instrument time scanning empty slide. Raman Sample Analyzer solves exactly that.
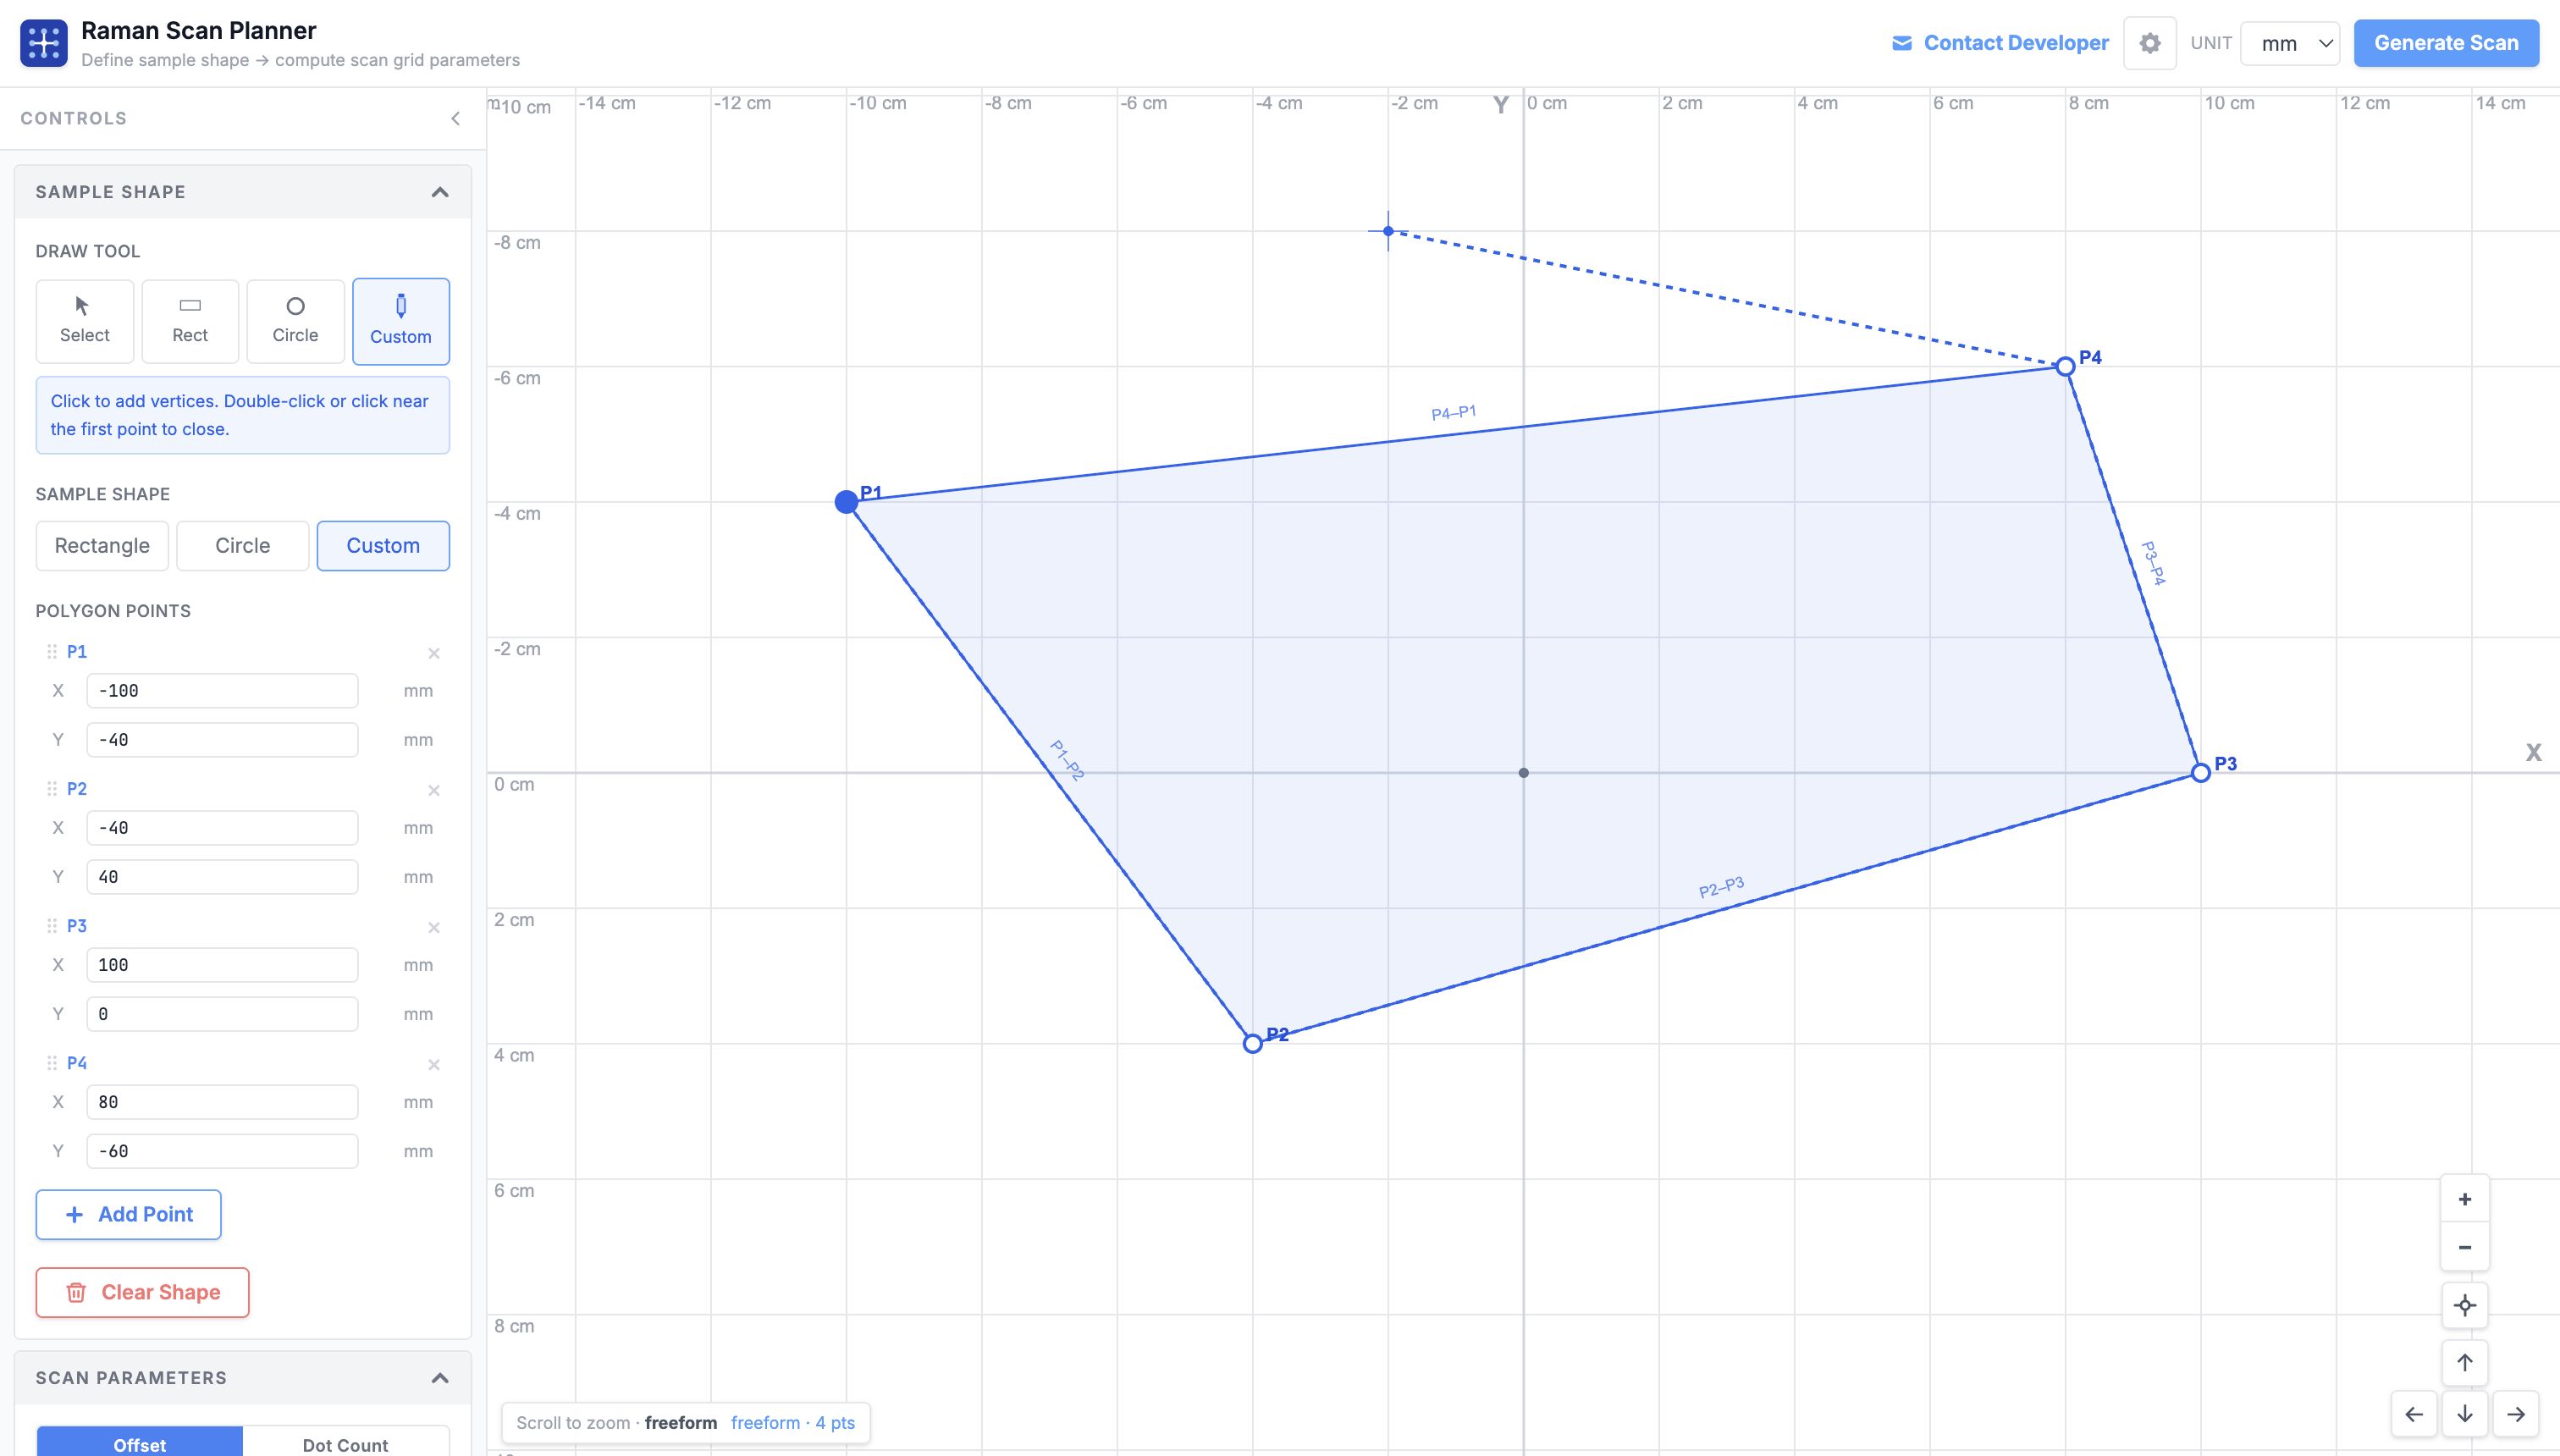
Draw what you actually want to measure #
Most samples aren't rectangles. A tissue cross-section has irregular borders. A crystal fragment is polygonal. A cross-sectioned fiber is circular. Raman Sample Analyzer lets you trace the exact outline of your region of interest: rectangle, circle, or a fully custom freeform polygon, directly on a calibrated canvas using real microscope coordinates in µm or mm.
Only measure what's inside the shape #
Once your shape is drawn, set your step size in X and Y (or target dot count) and hit Generate. The planner uses a point-containment algorithm to build a scan grid that covers only the points inside your defined region, skipping every empty area. No wasted spectra, no inflated scan time, no post-processing to remove dead points. You get start coordinates, Δx/Δy deltas, Nx × Ny grid dimensions, and total point count, ready to enter directly into your instrument software.
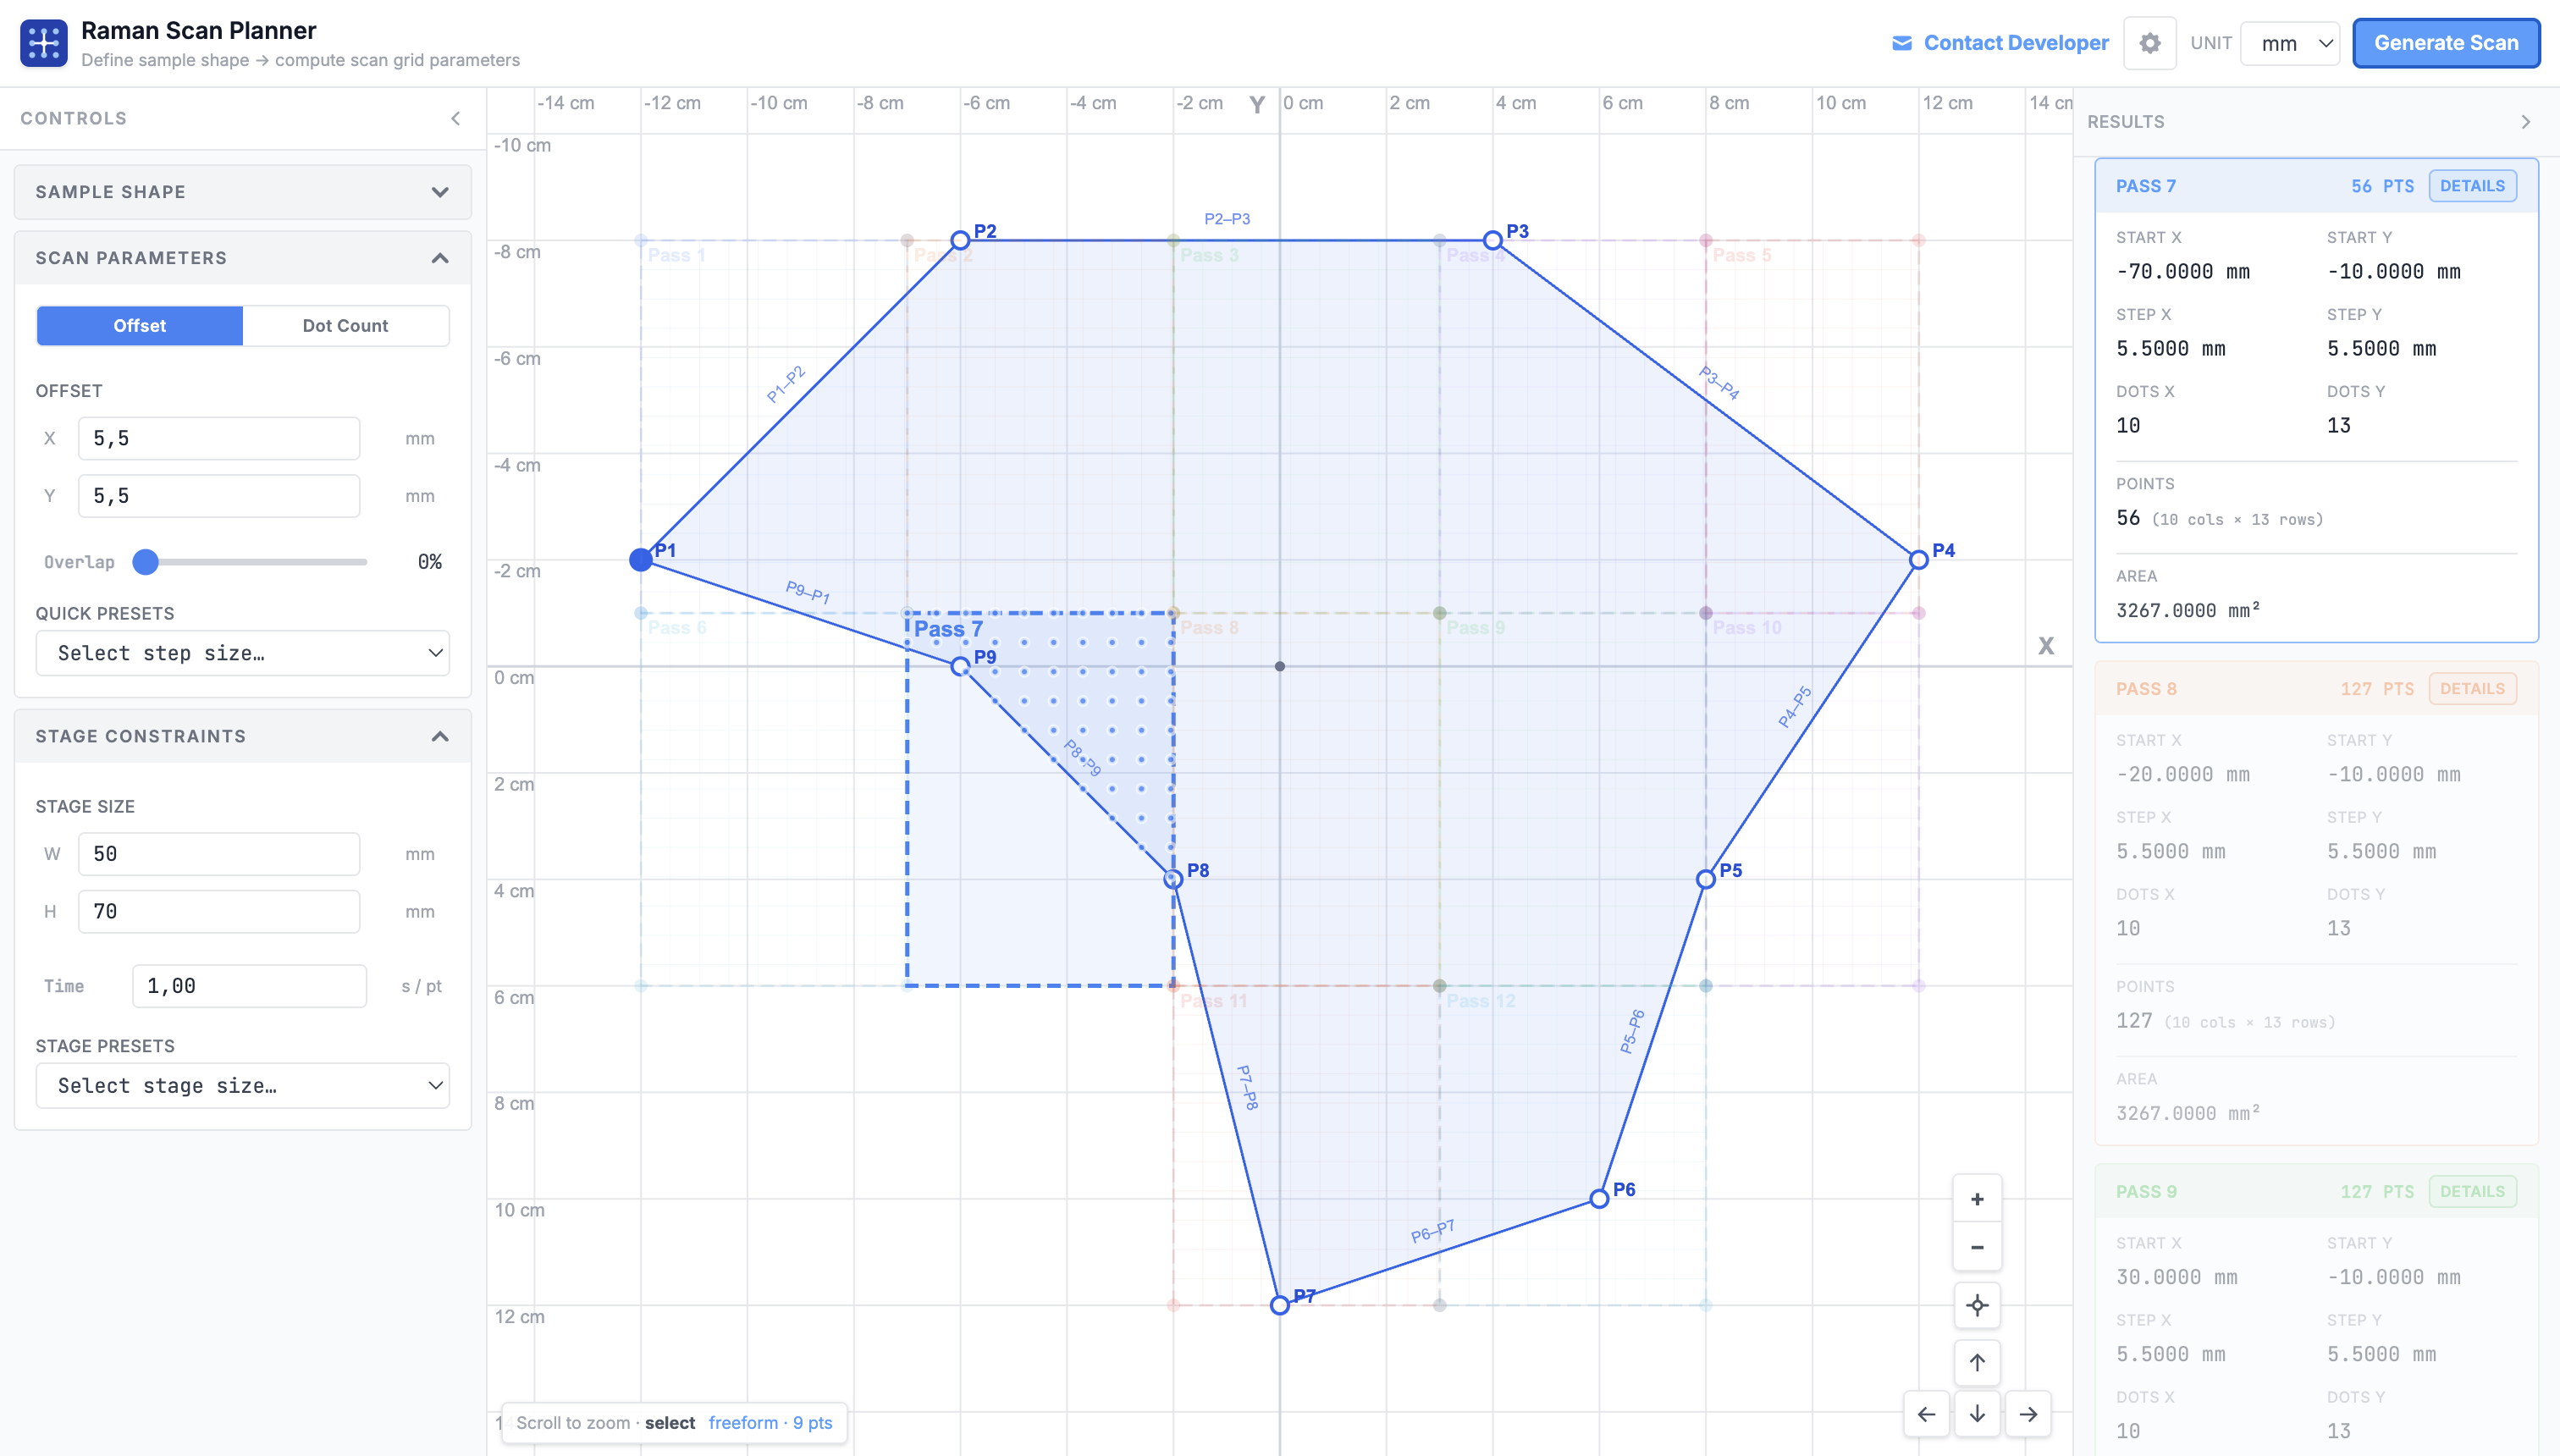
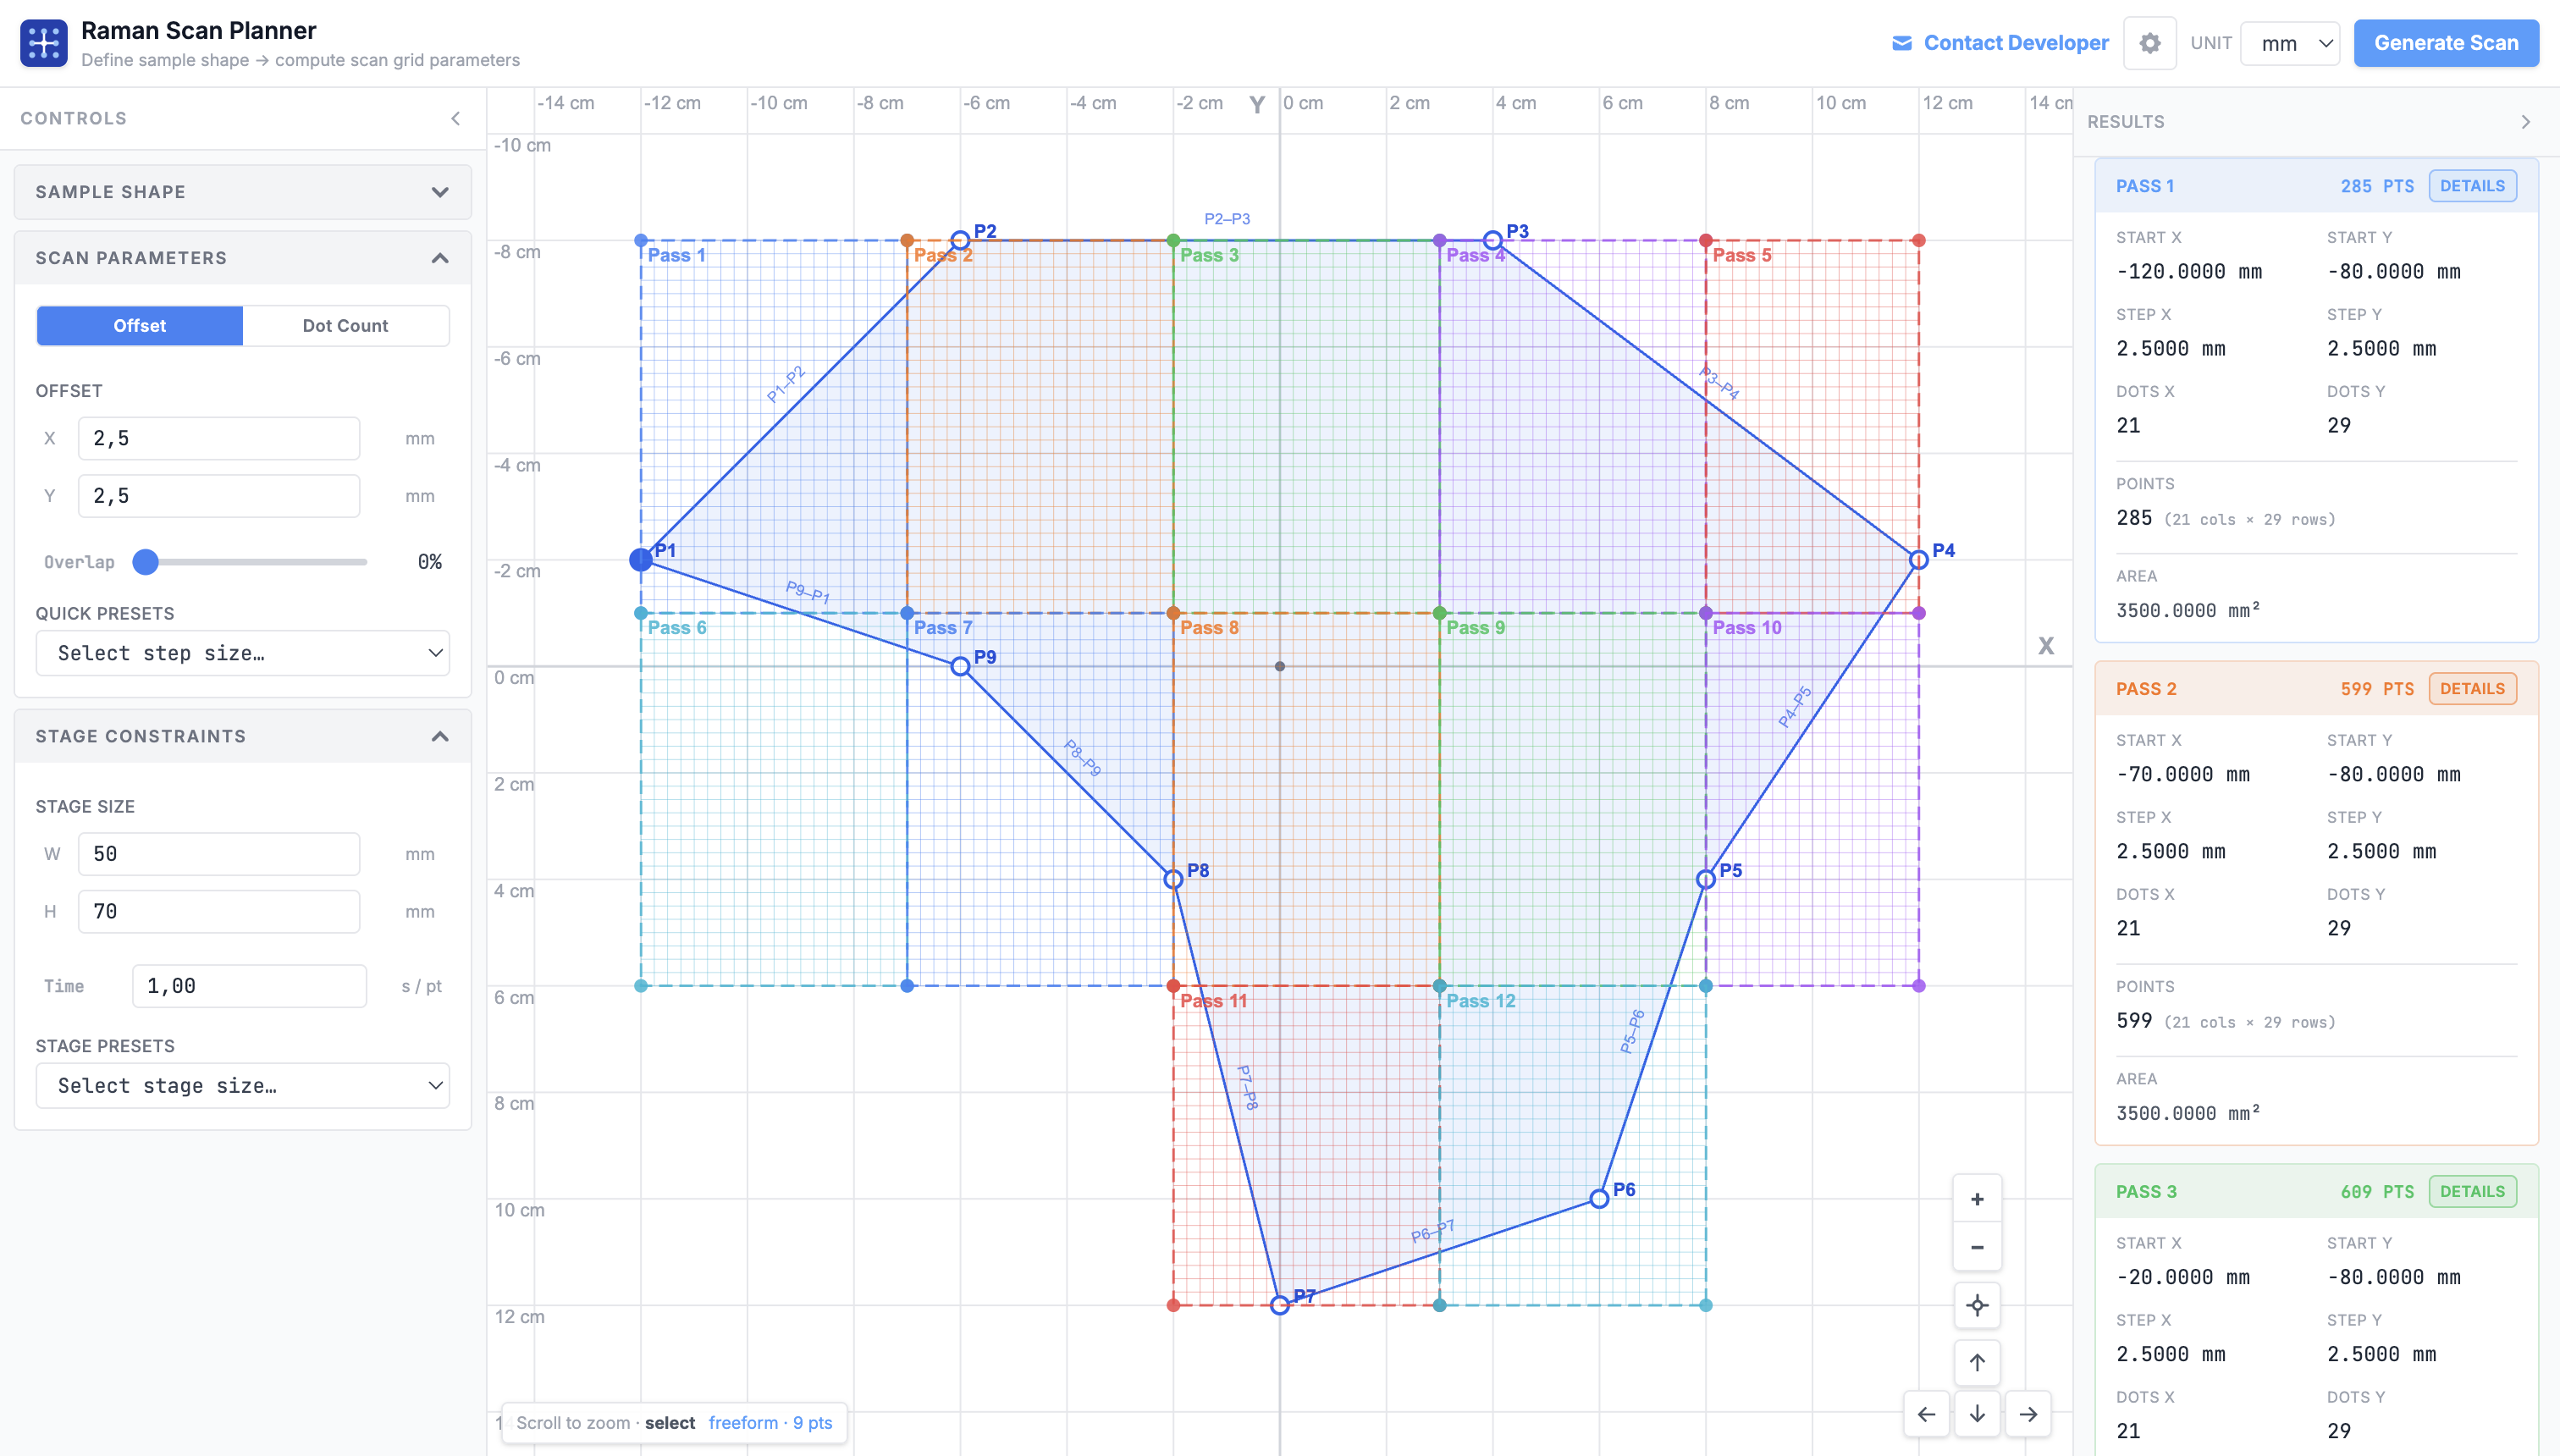
Sample bigger than your stage travel? Handled. #
Instruments like the Thermo Scientific DXR3 have a maximum stage scan range, typically 90 mm × 70 mm per pass. When your sample is larger, you'd normally split the scan manually, figure out the tile boundaries, and reposition the stage between each tile. Raman Sample Analyzer does this automatically. Enter your stage size limit once and the planner tiles your region into the minimum number of passes, computing exact start coordinates for each pass so you know exactly where to position the stage. All passes are shown simultaneously on the canvas with distinct colors.
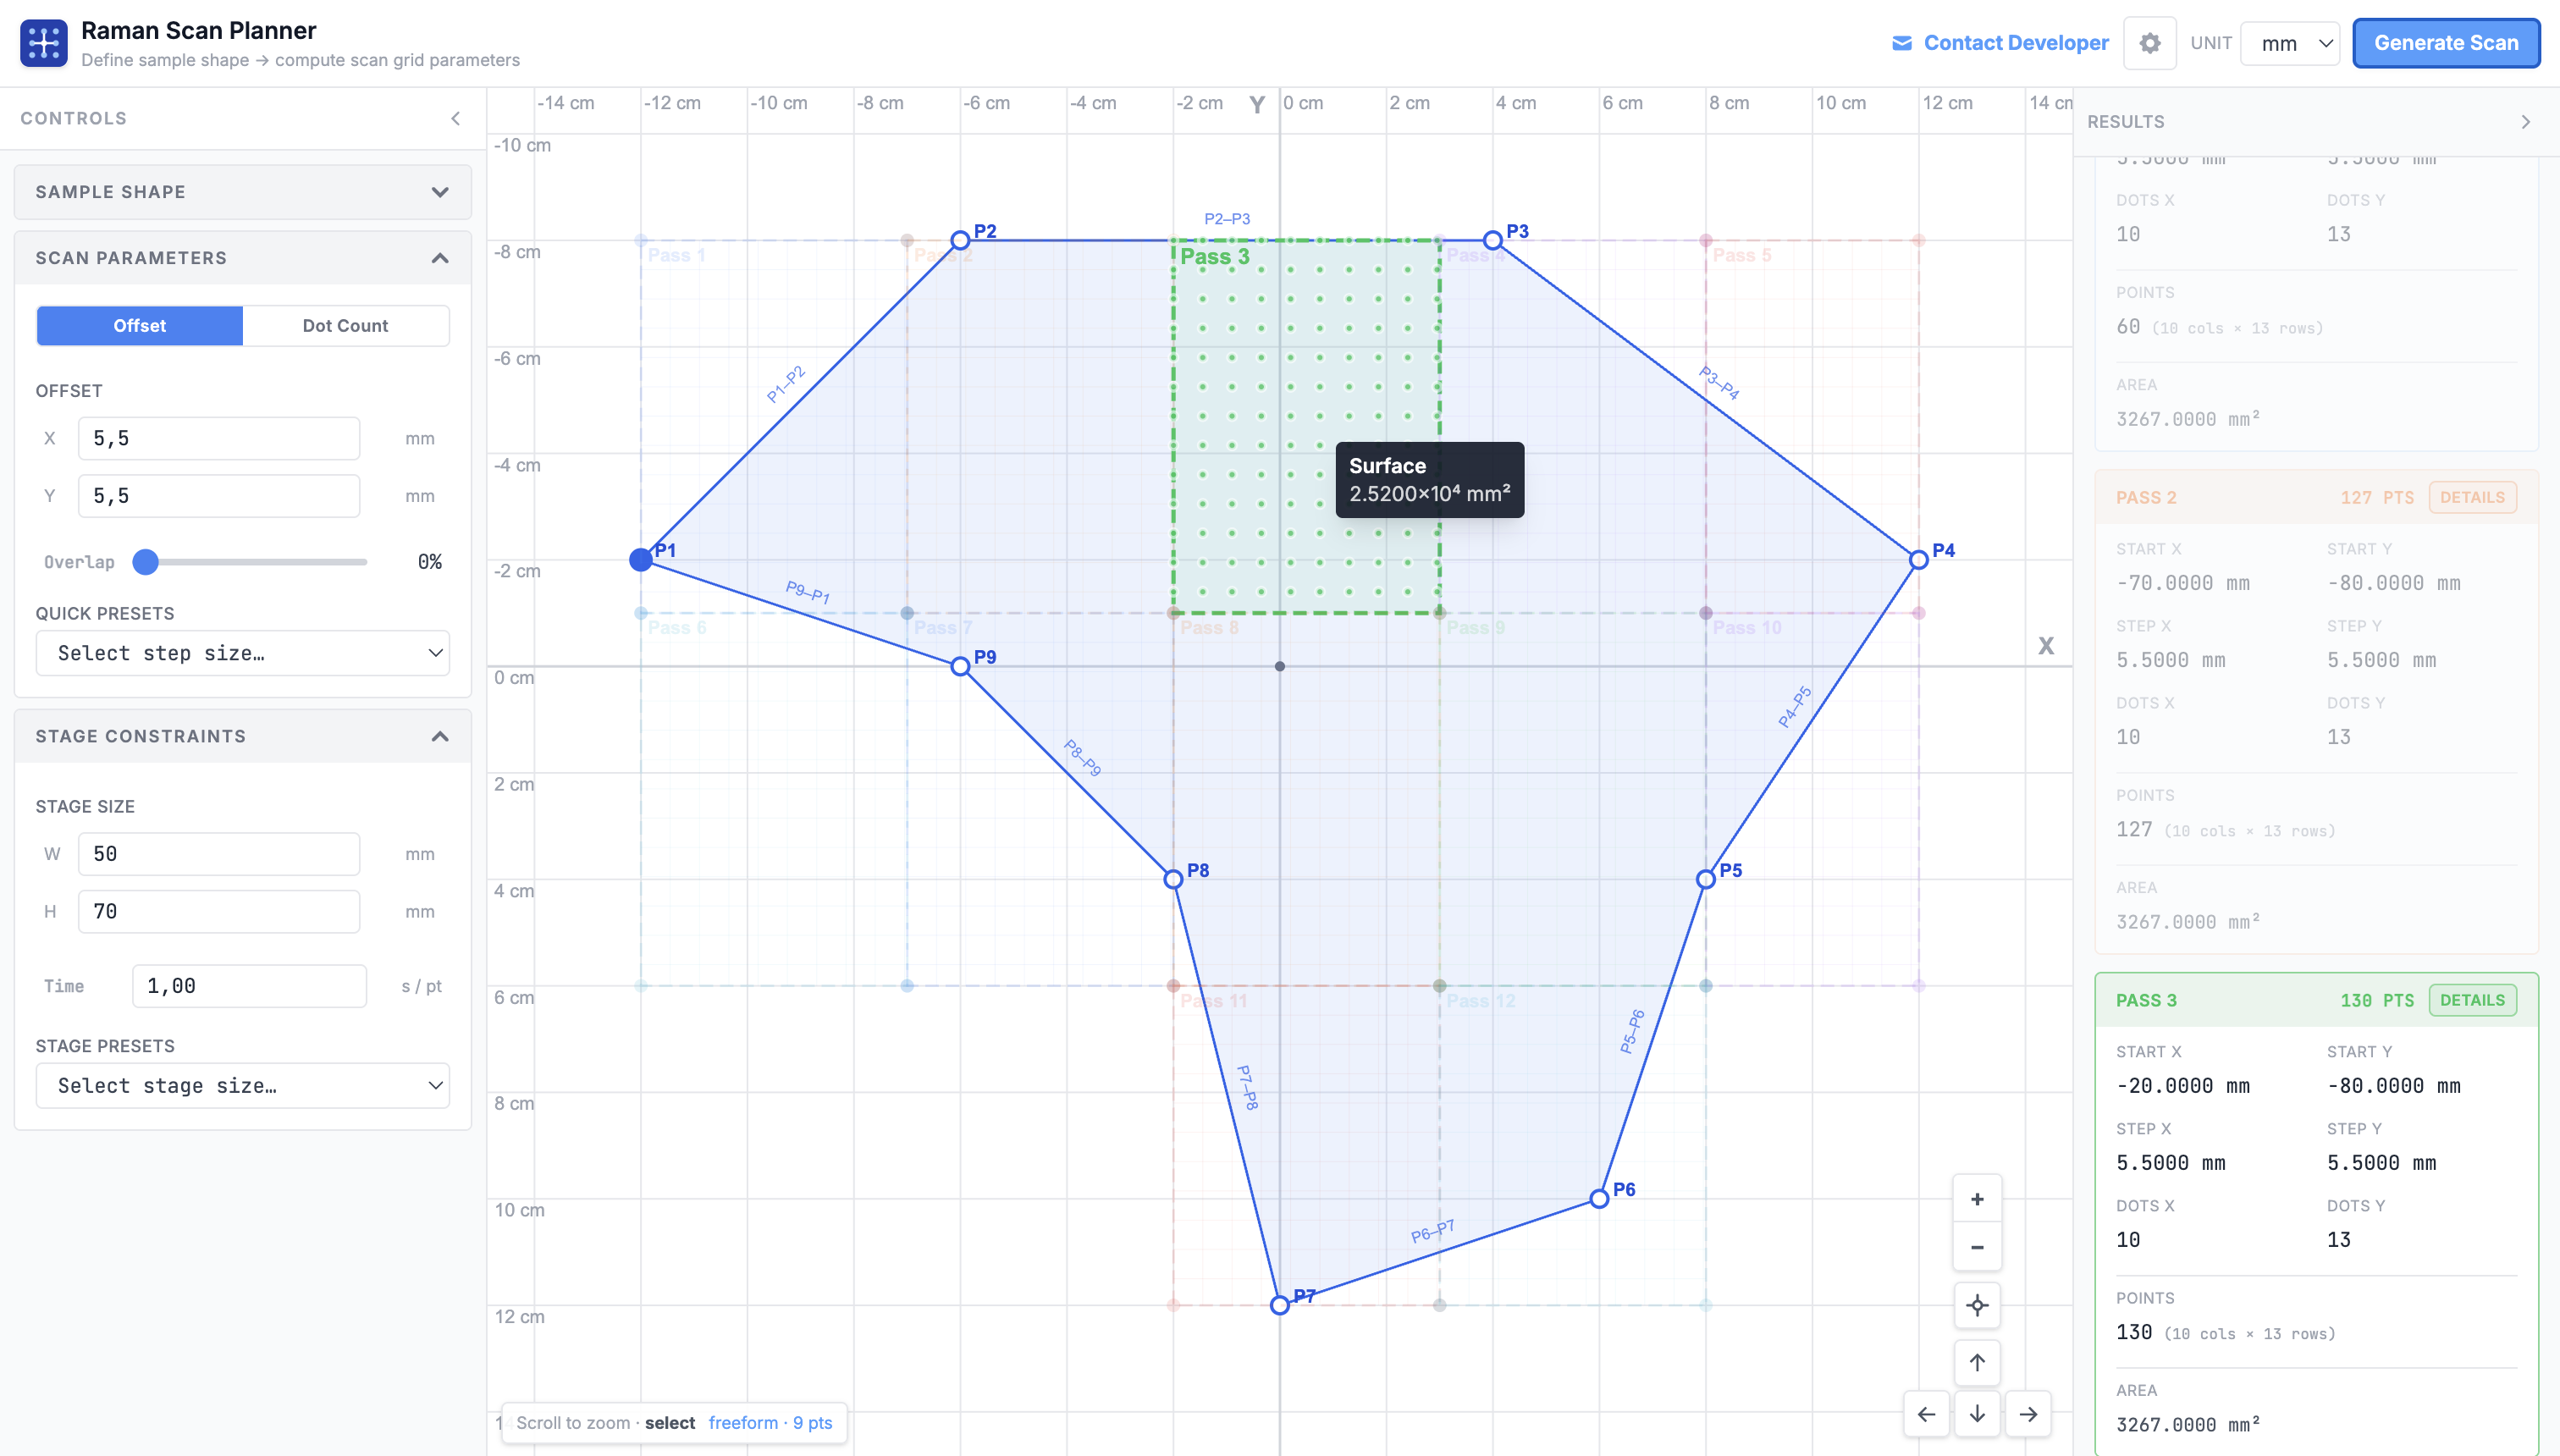
Know your scan time before you start #
A poorly planned scan can tie up an instrument for hours or days. Raman Sample Analyzer calculates an estimated total scan time from your step size and the time-per-point you configure for your hardware. Hover any pass region to see its covered surface area instantly. Adjust step size or overlap and the estimate updates in real time, so you can find the right resolution vs. time tradeoff before touching the microscope. If your point count exceeds 10,000 or 50,000 points, explicit warnings appear to help you catch oversized scans early.
Built for real instrument work
Every feature in the planner came from an actual frustration with manual scan setup. There's no account, no installation, no dependencies to manage. Open the browser and start drawing.
Three shape types
Rectangle, circle, and fully custom freeform polygon with editable vertex coordinates.
Step or dot-count input
Enter a step size in µm or a target number of scan points; the other value updates automatically.
Automatic multi-pass
Splits large regions into minimum-tile passes when sample exceeds your configured stage travel limit.
DXR3-ready presets
Stage presets for Thermo Scientific DXR3 and other models included out of the box.
µm / mm unit switching
Work in whichever unit your instrument uses. All values convert instantly.
Open source
MIT licensed. Built with React, TypeScript, and Konva. Fork, adapt, self-host.
What's new #
- Draw sample regions as rectangles, circles, or fully custom freeform polygons
- Interactive canvas with zoom and pan, calibrated in real microscope coordinates
- Editable polygon vertex coordinates directly in the control panel
- Point-containment algorithm generates scan points only within the defined shape
- Step size input (µm) or target dot-count mode with automatic synchronization
- Configurable X/Y overlap fraction
- Outputs start point, delta X/Y, Nx × Ny grid dimensions, and total point count per pass
- Automatically tiles samples that exceed the configured stage travel limit into minimum passes
- Each pass shown with distinct color on the canvas
- Exact start coordinates for each pass ready to enter into instrument software
- Configurable max scan width, max scan height, and time-per-point for your instrument
- Built-in stage presets
- Estimated total scan time calculated from point count and time-per-point
- Alert when scan exceeds 10,000 points (large) or 50,000 points (very large)
- Warning for step sizes below 1 µm that may exceed hardware positioning precision
- Warning when no scan points are generated due to shape or step size mismatch
- Switch between µm and mm units throughout the interface
- Dark and light theme support
- Surface area tooltip on hover for any pass region